Why Traditional Student Data Conversations Can Fall Short (And What to Do Instead)
In schools and districts across the country, educators have more access to data than ever before. Grades, attendance, test results, student work, it’s all at our fingertips. But even when teams invest time in examining data, figuring out how to turn insights into real classroom change can still feel out of reach. The data is there. The urgency is real. And still, identifying gaps and next steps is often not enough to spark the deeper shifts that lead to meaningful improvement.
That’s because even when we have the numbers and can spot the patterns, the why behind them can be harder to uncover, and identifying what to focus on first isn’t always straightforward.
At Partners in School Innovation, we coach educators through this challenge all the time, helping teams create the structures and conditions for their student data conversations to lead to shared learning and sustained action.
This is the first post in our series focused on reimagining data-driven instruction in schools, where we’ll explore how educators can use quantitative and qualitative data as tools for learning and liberation. Each post will spotlight a different way to analyze and act on data through a liberatory lens, from uncovering the human stories behind your data to turning insight into action through collaborative routines.
Rethinking What “Data Driven Instruction" Means
Too often, data is used as a tool for accountability, used to rank, sort, and judge rather than to illuminate and inspire learning and action. When we use data in this way, we risk reinforcing inequities instead of disrupting them.
Looking at student data through a liberatory lens shifts that focus. It means using data to learn together, notice patterns of inequity, and design changes rooted in curiosity, not compliance. It also means recognizing that numbers tell only part of the story. We can learn just as much from relationships, observations, emotions, and lived experiences.
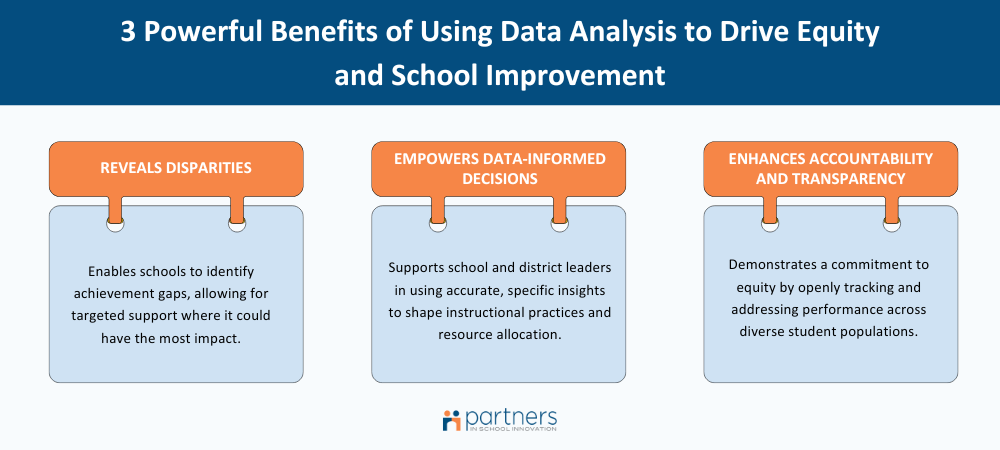
A graphic highlighting three benefits of implementing data analysis for equity-focused improvements in schools. The benefits outlined are 1. Reveals disparities 2. Empowers data-informed decisions and 3. Enhances accountability and transparency.
When we view data as part of a learning culture, mistakes become opportunities to learn and lead improvement efforts. Strengths are celebrated. Teachers and students are seen as more than test scores. And data begins to highlight perseverance and progress, not just perfection.
To start, let’s look at two practices teams can use to turn data into shared learning. One helps build clarity around what success looks like, and the other helps uncover what student work reveals about learning.
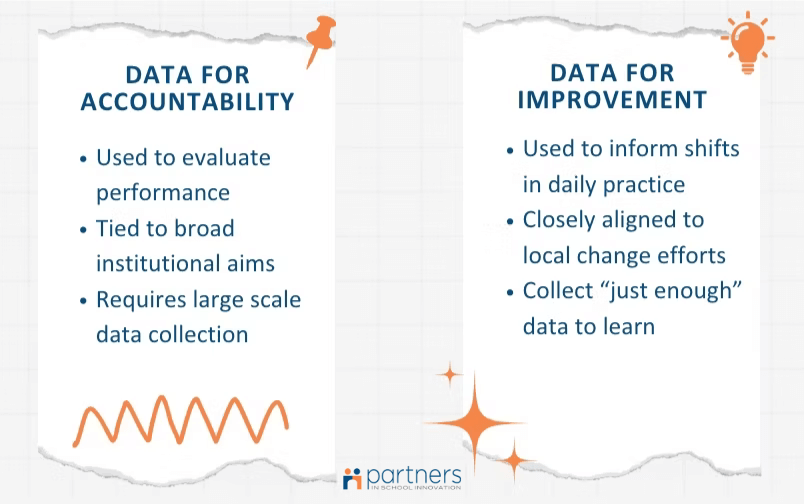
Source: Data for Liberation Course by Partners in School Innovation
Data Strategy 1: Finding Common Ground Before Looking at Student Data
All teams care deeply about their students and want to make sense of what the data is showing. But sometimes, we move quickly to the numbers before taking a moment to agree on what success actually looks like. Without that shared picture, even thoughtful discussions can leave everyone unsure about what to do next.
This is where a practice we call Calibrate on Proficiency can help. It gives teams a structured way to look at student work together and talk through what mastery looks like. This strategy is about working together as a team of educators to build a shared understanding of what mastery looks like, so that future data conversations are grounded in clarity, trust, and a common language about student learning.
Here’s what this can look like in action:
A sixth-grade writing team sits down with essays from a recent performance task. Before scoring, they review the rubric together and read an exemplar that shows what strong evidence and reasoning look like. Then, they select a student sample, and each teacher independently scores it before sharing their reasoning. As they discuss their scores, they notice different expectations for what counts as “adequate” versus “strong” reasoning. By the end, they reach a shared understanding of what mastery looks like and adjust their rubrics and expectations accordingly.
If you’d like to try something similar with your team, here’s how to get started:
Choose one recent assignment or assessment.
Review or co-create a rubric that defines what mastery looks like.
Have each team member score the same student sample, then share your reasoning.
Talk through where you differed and what that means for your expectations.
Use what you learn to guide your next round of teaching or feedback.
When teams take time to clarify what “good” looks like together, later data discussions are clearer, kinder, and more productive. Remember to frame this exercise as a way to build shared understanding.
Tip: Try doing this exercise before diving into your next round of data analysis. It sets a strong foundation and helps ensure that when you look at data later, your team is working from a common understanding. Educators often find this works best at the start of a new unit, when planning across grade levels, or when introducing a new assessment.
With that clarity in place, the next question becomes: what’s behind the results we’re seeing? This next strategy helps teams look more deeply at student thinking to uncover what’s really happening with learning.
Data Strategy 2: Finding the Story Behind Student Work
Once teams share a clear understanding of what success looks like, the next question becomes why some students are struggling to get there. It's common for the first instinct to be reteaching the same lesson again, hoping it will stick the second time. But when we pause to look more closely, we can often uncover the misconceptions or misunderstandings behind those struggles and take more targeted, thoughtful approaches.
This is where a practice we call Understanding Common Errors can help. In this approach, educators look beyond which questions students got wrong to uncover the thinking behind those errors. By examining student work together, they identify patterns in understanding, talk through what might have caused confusion, and plan instruction that directly addresses those misconceptions.
What This Looks Like in Practice With Multilingual Learners
A ninth-grade algebra team reviews end-of-unit assessments and notices that multilingual learners performed lower on word problems. When they look more closely, they realize the issue isn’t the math, it’s the language. More specifically they identify that students are misunderstanding key terms like “increase” and “combined.” The team decides to co-create a math vocabulary wall and use visuals to make problem-solving steps clearer.
If you’d like to try something similar with your team, here’s how to get started:
Pick one skill or concept students struggled with.
Review a small sample of student work tied to that skill.
Describe the patterns or misconceptions you notice.
Talk about what those mistakes tell you about how students are thinking.
Plan one change in instruction that directly addresses that thinking.
Tip: Keep the focus on curiosity. When teams look at what students were trying to do, not just what they got wrong, they gain valuable insight into how students think and learn. Those insights make reteaching more focused and more likely to stick.
Over time, these small shifts begin to change the culture around data, from something that feels evaluative to something that sparks learning and shared growth.
Want to Learn More About Student Data Analysis?
Join Our Online Community of Educators
Connect with 750+ equity-focused educators who are sharing real stories, tools, and inspiration every week. This free community is a space to learn with others who are transforming data into a tool for collective learning and equity. Join the online community here.
Explore Our Free “Data for Liberation” Course
Take your learning deeper with our self-paced, on-demand course “Data for Liberation”. You’ll gain more practical tools, reflective activities, and examples from real schools to help you build a culture where data inspires curiosity, not fear. Sign up for the free online course.
Work With a Partners in School Innovation Coach
If your school or district is ready to build capacity for equity-focused improvement, our coaches can help. We offer options for online and in-person support to guide teams through building the mindsets, systems, and routines that make lasting change possible. Contact our team to learn more.