How to Find the Stories Behind Student Data
In our work with districts and schools, we often remind teams that data is more than percentages, charts, and spreadsheets. Numbers can point us toward a pattern, but they don’t explain it. They don’t show us the experiences, strengths, or challenges happening behind the scenes for students.
At Partners in School Innovation, we help teams expand their definition of “data” to include student work, identity, lived experience, and voice, because when we widen that lens, data becomes less about accountability and more about understanding (and ultimately, about creating conditions where every student can thrive).
This second blog in our series on reimagining data conversations explores two practices that educational leaders and teams can use to move beyond numbers and toward deeper, more humanizing insights. Both strategies help educators tell fuller stories about their students by pairing quantitative data with what students show and say. [See the first article in the series, “Why Traditional Student Data Conversations Can Fall Short (And What to Do Instead),” here.]
A quote from Dr. Ivory Toldson, a professor at Howard University and bestselling author. The quote reads: “Many people use data to understand people. But we should use people to understand data...Behind every statistic, there is a person with dreams, aspirations, fears, and needs. Separating numbers from people allows people to oppress people without conscience or consequence.”
Data Strategy 1: Identifying Trends Across Student Groups
Identifying trends across student groups is a practice where educators look closely at how different student groups are experiencing learning. Instead of only asking, “How did the class do overall?,” teams ask questions like:
“Who is this working for?”
“Who might be experiencing school differently?”
“What patterns do we notice across different groups of students?”
When educators look at data by student groups rather than only whole-class averages, new patterns are easier to spot. Disaggregating data by factors like language status, race/ethnicity, or gender can help educators notice whose needs are being met and where students may be experiencing school differently. This becomes an early step in identifying inequities and planning supports that meet students where they are.
When educators disaggregate data (that is, break data down by language status, race/ethnicity, gender, or other meaningful groups) to identify trends across student groups, they can uncover patterns that class averages often hide and better understand where to focus their efforts to close gaps and improve outcomes.
This is an early step in understanding whose needs are being met and whose needs may be going unseen. This shift helps educators surface inequities, examine their instructional practices more holistically, and plan supports that are responsive to students’ real needs.
Use this practice when:
You want to understand the experiences of multilingual learners, students of color, or students with other shared characteristics
You’re building a school improvement plan around equity
You’re preparing to dig deeper with focal students or student work
Example: How One School Used Disaggregated GPA Data to Uncover Hidden Inequities
In one professional learning network led by Partners in School Innovation, school leaders set a goal for 90% of students to maintain a GPA of 2.0 or higher. On the surface, one school appeared close to meeting the goal - 87% of students had at least a 2.0 after Quarter 1.
But when the team disaggregated the data, they noticed that:
Students who still had GPAs below 2.0 often had overlapping challenges such as inconsistent attendance or behavioral concerns.
When they disaggregated further by ethnicity and gender, they saw that Hispanic boys made up the majority of students below a C average.
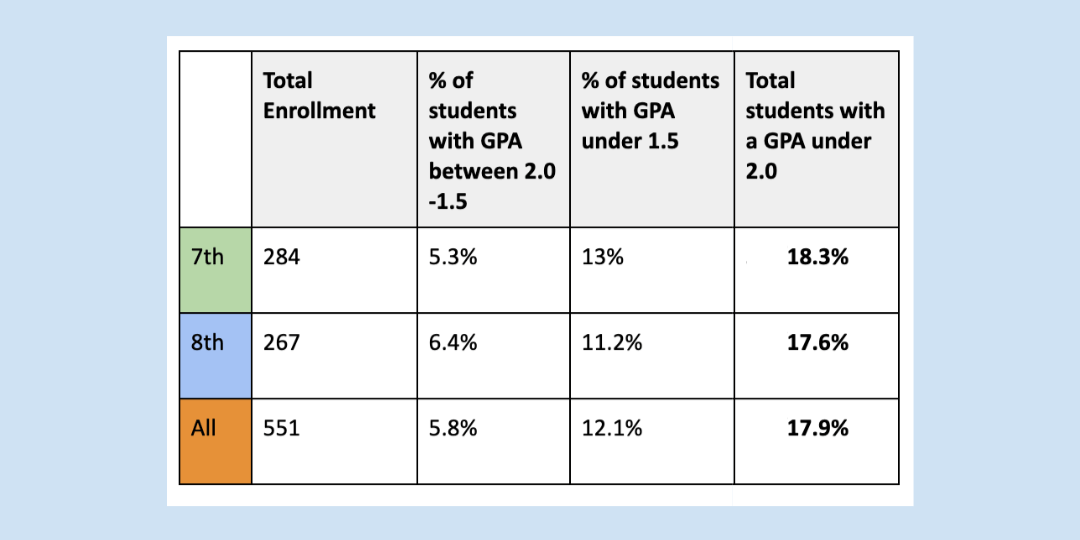
A data table from our “What Is Disaggregated Data?” blog showing GPA trends by grade level. The chart breaks down the total enrollment in 7th and 8th grade and the percentage of students with GPAs between 2.0–1.5, below 1.5, and below 2.0 overall.
These insights helped the team design more targeted supports, such as strengthening relationships with those students and families, improving attendance outreach, and creating more structured academic support for students who were facing multiple barriers.
The school walked away with a clearer understanding of who needed support and why, something that was only possible because the team took time to break the data down and study patterns across groups.
Once a school team begins noticing trends across student groups, the next step is often to understand the experiences behind those patterns. Disaggregated data can tell us where to look more closely, but it can’t tell us why students are having different experiences.
This is where learning from focal students becomes a powerful practice.
Data Strategy 2: Learning From Focal Students
When we talk about “focal students,” we’re talking about choosing a small number of students–often those the data suggests may not be experiencing school in the way we hope–and slowing down to learn from their lived experiences. Instead of analyzing numbers from a distance, this strategy is about getting close to the classroom experience through observation, conversation, and reflection.
Working with focal students helps educators move from assumptions, humanizes data, and reminds us that every pattern represents real students with real stories.
Use This Practice When:
You want to understand the experiences behind a data trend.
You’re working toward more equitable outcomes and need insight into daily student life.
You’ve noticed gaps that numbers alone can’t explain.
You’re preparing to design or refine instructional strategies with a specific student-group in mind.
What This Looks Like in Practice
When teams engage in learning from focal students, they typically:
Choose two to four students whose experiences they want to understand more deeply.
Observe them during class to notice how they engage, participate, and interact with the learning environment.
Look at their work samples to explore how they’re making sense of content.
Talk with the students directly through short empathy interviews.
Reflect as a team on what they learned and what it means for instruction
The goal isn’t to evaluate students, but to understand their experience well enough that we can design instruction or interventions that truly meet their needs.
Example: How a San José School Used Focal Students to Strengthen Multilingual Learner Support
During our partnership with a large intermediate school in East San José, leaders wanted to improve outcomes for their multilingual learners. Their early data showed performance gaps, but the “why” behind those gaps wasn’t yet clear.
So, the instructional leadership team spent a day shadowing several multilingual learners, observing their classes, watching how they engaged in group work, and noting when they participated and when they held back.
Even though teachers had intentionally designed collaborative lessons, they noticed that multilingual learners spent much of the day working silently or passively. They rarely had opportunities for structured academic talk, and many appeared hesitant to participate in discussions because they weren’t confident with the language demands.
When educators interviewed these focal students afterward, they heard comments like:
“I’m afraid I’ll say something wrong.”
“I don’t always understand the words in the directions.”
“It’s hard to jump into group discussions.”
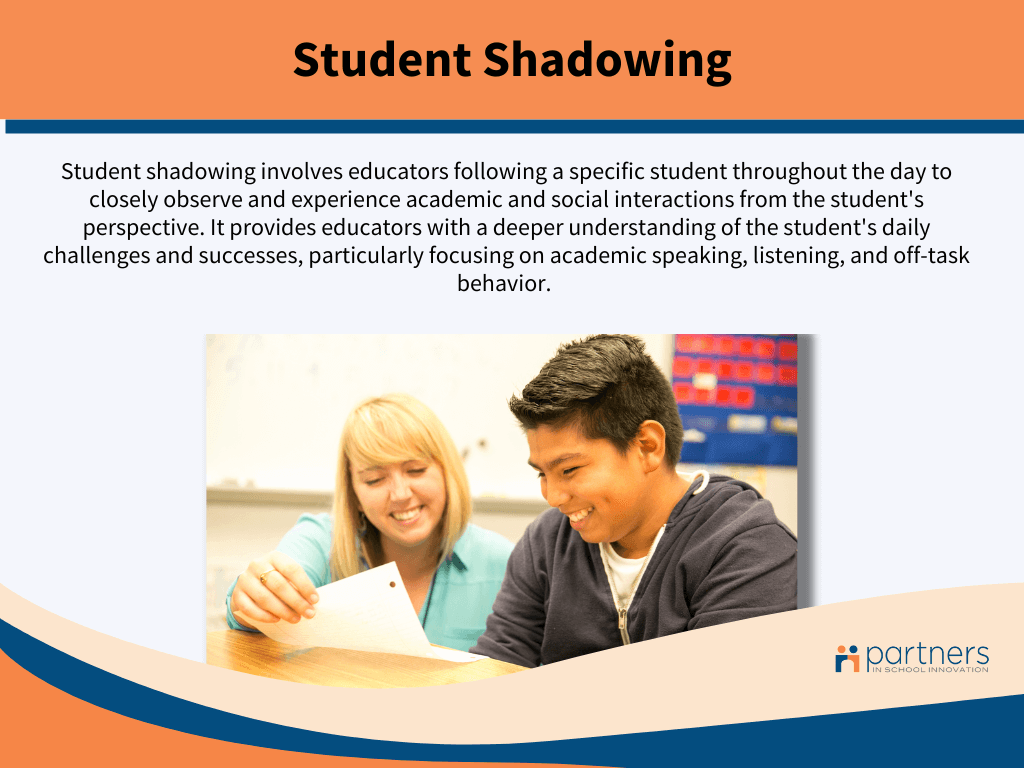
A visual graphic explaining student shadowing as a practice where educators follow a specific student throughout the day to closely observe and experience their academic and social interactions. It includes an image of a student and teacher working together in a classroom setting.
Using those insights, the team realized that reteaching content or assigning more practice wasn’t the solution. Instead, they shifted their focus to strengthening language support. So, they worked with Partners to focus on adding structured discourse routines, vocabulary scaffolds, and clearer opportunities for students to talk with one another about their thinking.
The following year, the school saw a 250% increase in multilingual learners reclassified as Fluent English Proficient and a 60% reduction in Long-Term English Learner identification.
A quote from a teacher who participated in the MLL shadowing that reads: “Seeing where they were doing well and where they needed help gave us concrete examples to develop better intervention techniques.”
A large part of that improvement came from noticing and listening to students’ lived experiences.
The examples shared are a reminder that behind every data point is a student with a story. When we take time to look beyond the initial numbers, we can gain the kind of insight that makes meaningful change possible across schools and within classrooms.
Want to Learn More About Using Data for School Improvement?
Join Our Online Community of Educators
Connect with 750+ equity-focused educators who are sharing real stories, tools, and inspiration every week. This free community is a space to learn with others who are transforming data into a tool for collective learning and equity. Join the online community here.
Explore Our Free “Data for Liberation” Course
Take your learning deeper with our self-paced, on-demand course Data for Liberation. You’ll gain more practical tools, reflective activities, and examples from real schools to help you build a culture where data inspires curiosity, not fear. Sign up for the free online course.
Work With a Partners in School Innovation Coach
If your school or district is ready to build capacity for equity-focused improvement, our coaches can help. We offer options for online and in-person support to guide teams through building the mindsets, systems, and routines that make lasting change possible. Contact our team to learn more.